In my last post on Investment, I have introduced the concept of investment risk, by means of a fictive example yielding one of two possible results. But this is obviously an overly simplistic way of viewing things! In reality, as anyone who ever tried the stock market knows, a portfolio of investments, can yield a whole continuum of potential outcomes, from the very negative, to the very positive, and anything in between. Today, I want to illustrate stock volatility in action, and infer from that what I believe is the most useful way of viewing an investment.
Volatility in action
So let us say it is now December 31st, 2012. Let us consider 100 different stock investments, each initially worth 100$, in 100 different US large capitalization stocks. And for the sake of this discussion, I have chosen the 100 stocks constituents of the S&P100 Index, as of Dec 2012.
So what happened to each of these investments in the next 5 years after the investment, that is, until Dec 31st, 2017? As of today of course, we have the benefit of hindsight. See on Fig 1 below how each of these investments have fared.
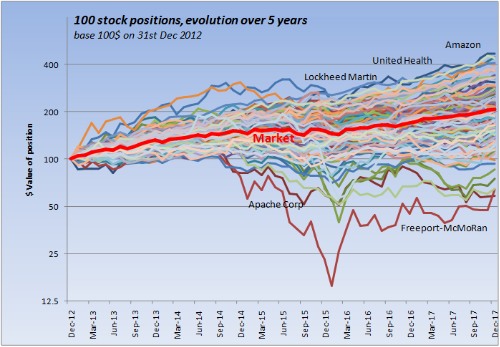
Fig 1. Evolution of a 100$ investment in each of the 100 stocks of the S&P 100 Index, over 5 years, starting 31st Dec 2012. In thick red, the overall market performance for the period (here, the S&P 500 Index). Please note that I have used a logarithmic scale on the Y axis (i.e. growing by gradual factor 2 increase).
A few exceptional stocks were highlighted in the graph.
On the high side, the top ones were Amazon, United Health and Lockheed Martin, each ending up over 400$ each at the end of the period.
Also notice how a few stocks clearly underperformed all the others. The two bottom brown stocks are Freeport McMoRan (light brown) and Apache Corp (dark brown). Then both ended the period at about 65$ each. Freeport McMoRan crashed all the way down to 15$, then never quite recovered within the 5 years.
To understand why that happened, you would need to look into the news for this particular company around 2015. But this is a clear example of what I have called “specific risk” in my introduction post. It stems from particularly bad business news hitting the company, definitely out of Business As Usual. It is the sort of risk you want to avoid! If you had all your fortune in this one stock, by the end of the period you would have lost about 35% of your savings! And that, when the whole market, in the same period, increased about 100%. You can’t let your fortune tied to the specifics whereabouts of just one company!
Dispersion in values
But if we exclude the bad sheep that misbehaved in this way, the whole majority of the positions ended in a continuous range worth between 100$ and 400$. Also note how the dispersion in values increases with time. As of Dec 2013, for instance, the bulk of the stocks positions were worth between 115$ and 210$. There is an overall movement upwards, plus some increasing dispersion around this average. This is best seen on Fig 2. below.
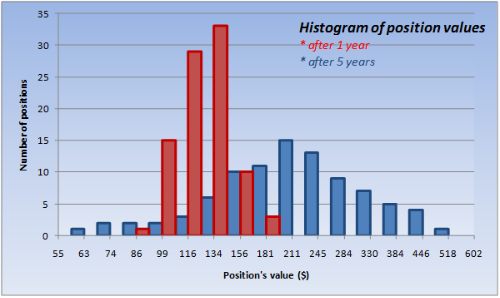
Fig 2. Histogram showing the dispersion in positions values, after 1 year, and after 5 years. This reads “number of stock positions whose values fall in between two ticks marks”. For instance, the peak red rectangle says “after one year, there are 33 positions whose value fall between 134$, and 156$”. The interest of this graph is to show the increasing dispersion, over time, in the range of potential outcomes.
That’s Volatility in action: an initial investment of 100$ in Dec 2012 in one stock, ends up being worth anywhere between 100$ and 450$ five years later!
Volatility as potential outcomes of a single stock
Now think about it. If it’s Dec 2012, and you are holding one of these stock position, you do not have the benefit of hindsight at this stage. You have no way of knowing for sure which one of these your stock will end up to be – and don’t let anyone tell you otherwise! And as of Dec 2012, the path that your investment’s value is about to follow, could be any of these!
So this suggest a very interesting idea. That particular stock is about to incur one of several possible random paths, representing various possible outcomes. We will only know later on which of these paths ended up being realized. But as of now, they are all equally possible.
Simulating Risk
It sounds complicated, but it is not. We can simulate such random paths just like this.
- There is an overall, positive, expected return for each stock, which stems from the overall economic growth. All businesses strive for growth, and without a positive expected return there would be simply no incentive for investment. For the sake of this argument, let’s say it translates into 1.2% per month
- Each month, the base return of this stock will be this 1.2%
- But there are uncertainties of business and economy. To represent this uncertainty, or “risk”, just add a random number. This random number will be mostly in the range +/- 4% (again for the sake of this argument), with a 0% average.
- The sum of this random number (3) and the base return (2), will be the total random return for this month!
- You have the modeled return for the month, you know the value at the beginning of the month, you can now calculate the value at the end of the period!
- Generate one path over, say, 60 consecutive months by repeating steps 2-5
- Then generate 99 other paths, for a total of 100.
And when I do just this, here is what I get.
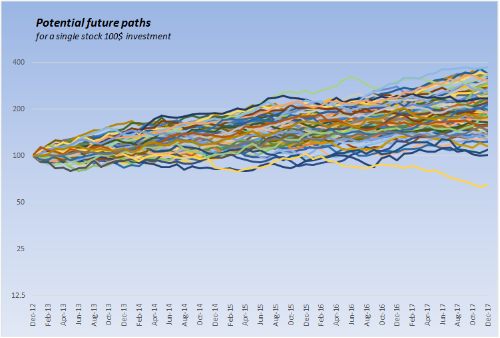
Fig 3. It is now Dec 31st, 2012, and our 100$ investment in a single stock is about to follow one of these paths… But we don’t know yet which one it’s going to be!
How does it connect with the view of realized volatility presented above? Assuming all 100 selected stocks have identical characteristics, as of Dec 2017, each of them ended up following one of these random paths. So Fig 1 is the materialization, in hindsight, of the many potential future paths of Fig 3, for 100 stocks.
And indeed, Fig 3 reproduces pretty accurately many features of Fig 1:
- overall growth rate
- spread in potential outcomes
- and increasing spread of outcomes over time
But the main striking difference is that it doesn’t display the sort of abrupt behavior that Freeport McMoRan or Apache Corp went through. The suggested modeling does not account for the company specific risk!
However! One of the takeaways from this post, as well as my previous one, is that you should absolutely reduce the specific risk as much as possible, by diversifying you portfolio of investments! So if we now think, not in terms of one stock, but in terms of a diversified basket of stocks, a behavior such as the one exhibited by Freeport McMoRan is now extremely unlikely, and will never be of the same extent. In this case, the modeling proposed becomes quite accurate!
The concept of Volatility
The Volatility of an Investment represents the spread in potential values, one year from now, expressed as a percentage of today’s value. Let us be more specific in Fig 4 below.
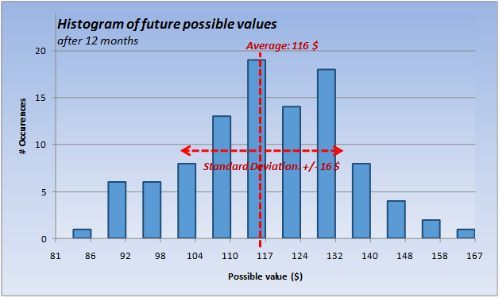
Fig 4. Histogram of potential values, after 12 months. It reads “number of simulated cases where the value fall in between two ticks marks”. For instance, the peak blue rectangle says “after one year, there are 19 simulated occurrences in which the value fall between 110$, and 117$”.
I have used the same simulation as in Fig 3, and just gathered the histogram of values after exactly 12 months.
We get the equivalent of Fig 2, but instead of being a number of actual stock positions in a given price range, it is now a number of simulated occurrences ending in the range, after 12 months, for one stock. The figure also shows the average outcome (116 $), as well as the “standard deviation” (+/- 16 $) around the average, where typically 70% of all outcomes would be.
This standard deviation (which was found to be equal to 15.5$), when expressed in percentage of the starting value (100$), is exactly what we call Volatility. The average value (116 $), tells us that in average, the stock position grew by 16%. This average growth is the expected return.
So a Volatility of 15.5% means that there is a 70% chance that the total return after one year will be between (16-15.5)% and (16+15.5)%, i.e. somewhere in the range 0.5% to 31.5%.
The Volatility measures the dispersion in potential outcomes after a year.
This is exactly how I have defined Risk in my last post. And indeed, Volatility is, in fact, the most used measure of Risk.
Measuring Volatility in practice
But if we go back to the previous section, step 3 of my simulation, I have sort of parachuted that the random number would have to be in the range +/-4 %. How did I know this was the value to use? Also, generating random paths the way I did do not seem like a very practical way of measuring volatility. But fortunately, provided some reasonable assumptions, there is a useful shortcut to estimating volatility. Here it is.
Provided that:
- immediate past returns will be statistically representative of what to expect in the near future;
- Consecutive returns are statistically independent from each other;
then we can use the immediate past returns observed for this investment and use the standard deviation mathematical function to estimate the volatility. We can, for instance, retrieve the last 60 months of observed returns. We then compute the standard deviation on these returns. This is exactly what yielded that +/-4% of my step 3.
The only technical problem here is, because I am using monthly returns, the standard deviation will express volatility over a one month horizon (and not 12 months as required by my definition of volatility). What mathematics tells us, however, is that the spread in outcomes grows proportionally to the square root of past time. So you just have to multiply this standard deviation by square root of 12, to get the desired, annual volatility. And in general, if you have estimated a standard deviation over a certain return period, you get an “annualized” volatility by multiplying by the square root of the number of such periods in a year.
Conclusion
This is quite a lot at once, dear Reader! What we have seen here is essentially this:
- The stock market grows over time as a consequence of global economic growth: this is what businesses do! Individual stock prices, however, exhibit a wide range of erratic behavior around this average (Figs 1 and 2)
- This is best thought as the result of random economic and business news hitting each company’s business. These news affect stock prices either way, sometimes positively, sometimes negatively. Figure 3 is a visual representation of this.
- As a result of these unpredictable news, it is impossible to know the future price of a given stock. Instead, it is best to think of a range of possible future values, centered around the expected value (Figure 4)
- This range of uncertainty increases as we increase the forecast horizon (illustrated on Fig 2, and seen on Fig 3)
- The range of possible values, a year from now, expressed as a percentage of today’s value, is called Volatility
- Technically, the Volatility is measured by estimating an “annualized” standard deviation from recent past returns. It is assumed that the same Volatility will prevail in the immediate future.
In my previous post, I have defined Risk as the range of possible future outcomes of an Investment. And argued that riskier investments are expected to return more, as a way to compensate for the Risk incurred. Volatility is such a measure of Risk, and the most widely used one. Although I used the specific context of stocks to introduce it, the concept of Volatility transcend the Equity asset class. It can be applied to other investment asset classes as well, such as Bonds, Commodities, Foreign Exchange, and even illiquid investment types such as Real Estate. This is the measure of Risk that I will adopt and use throughout this blog.
To conclude, Figure 3 above is the best representation of Volatility in action. And it is, arguably, the most useful way to think of an investment.
Yours,
![]()
